Duurzaam Nederland
November 2015
Amsterdam University of Applied Sciences
Purpose of the project:
The design challenge for this project was:
Can the Netherlands reach the goal of 14% renewable energy by 2020 with projects that are being developed at the moment or can be developed with the calculated budget of 17 million?
Deliverables:
A working website based on collected data. The libraries d3.js and Greensock.js must be used in the code. And hand in a document that shows the process and especially the research with the data.
My role:
In the first couple weeks, we were all sketching, coming up with ideas and styles for the website. Once we figured that out, I took care of the planning for the team and collected data with a teammate. I was also responsible for some motion design; the video that plays before you get to the tool on the website.
In the third year of my study, we first had class for 4 weeks and then 5 weeks to finish this project. This project was about data visualization. We decided to gather data about renewable energy in the Netherlands. Our government has a goal of reaching 14% renewable energy by 2020. But there are only negative comments about this and that we probably can't reach this goal. Yet there is no real proof that we can't make it.
I gathered data with another team member. We looked for possible projects connected to renewable energy. Finding these kinds of projects turned out to be way harder than expected. We had to make calls, send e-mails and make our own calculations to figure out what a project would cost, how long it would take and the MWh produce.
According to our calculations we can definitely reach the 14% goal by 2020. Because the budget of our government is 17 billion and we reach the goal with 14 billion for 15%. Our calculations aren't 100% reliable, but we just wanted to show that it's possible.
The original idea for this project was to show where in the Netherlands there were wind turbines. With what they produce and cost. But since something like that already exists, we started thinking of and sketching other things.
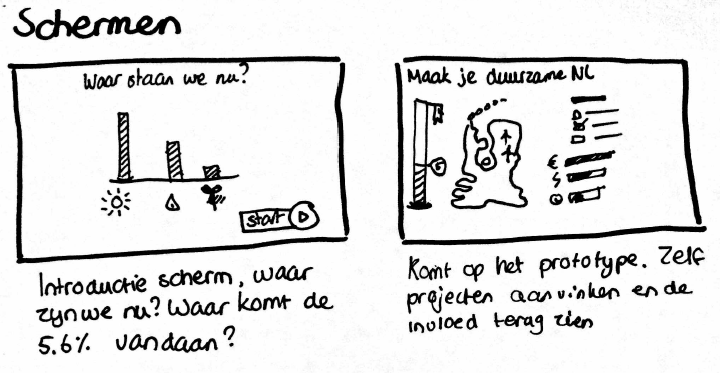
We all sketched out our own ideas, but ended up making a couple sketches that shaped our project. In the sketch above, we have a introduction screen with stats and then you get to the tool where you can create your own renewable energy plan to get to that 14%.
After the sketching, we made a prototype to see if it was technically possible. Here's a screenshot of that below:
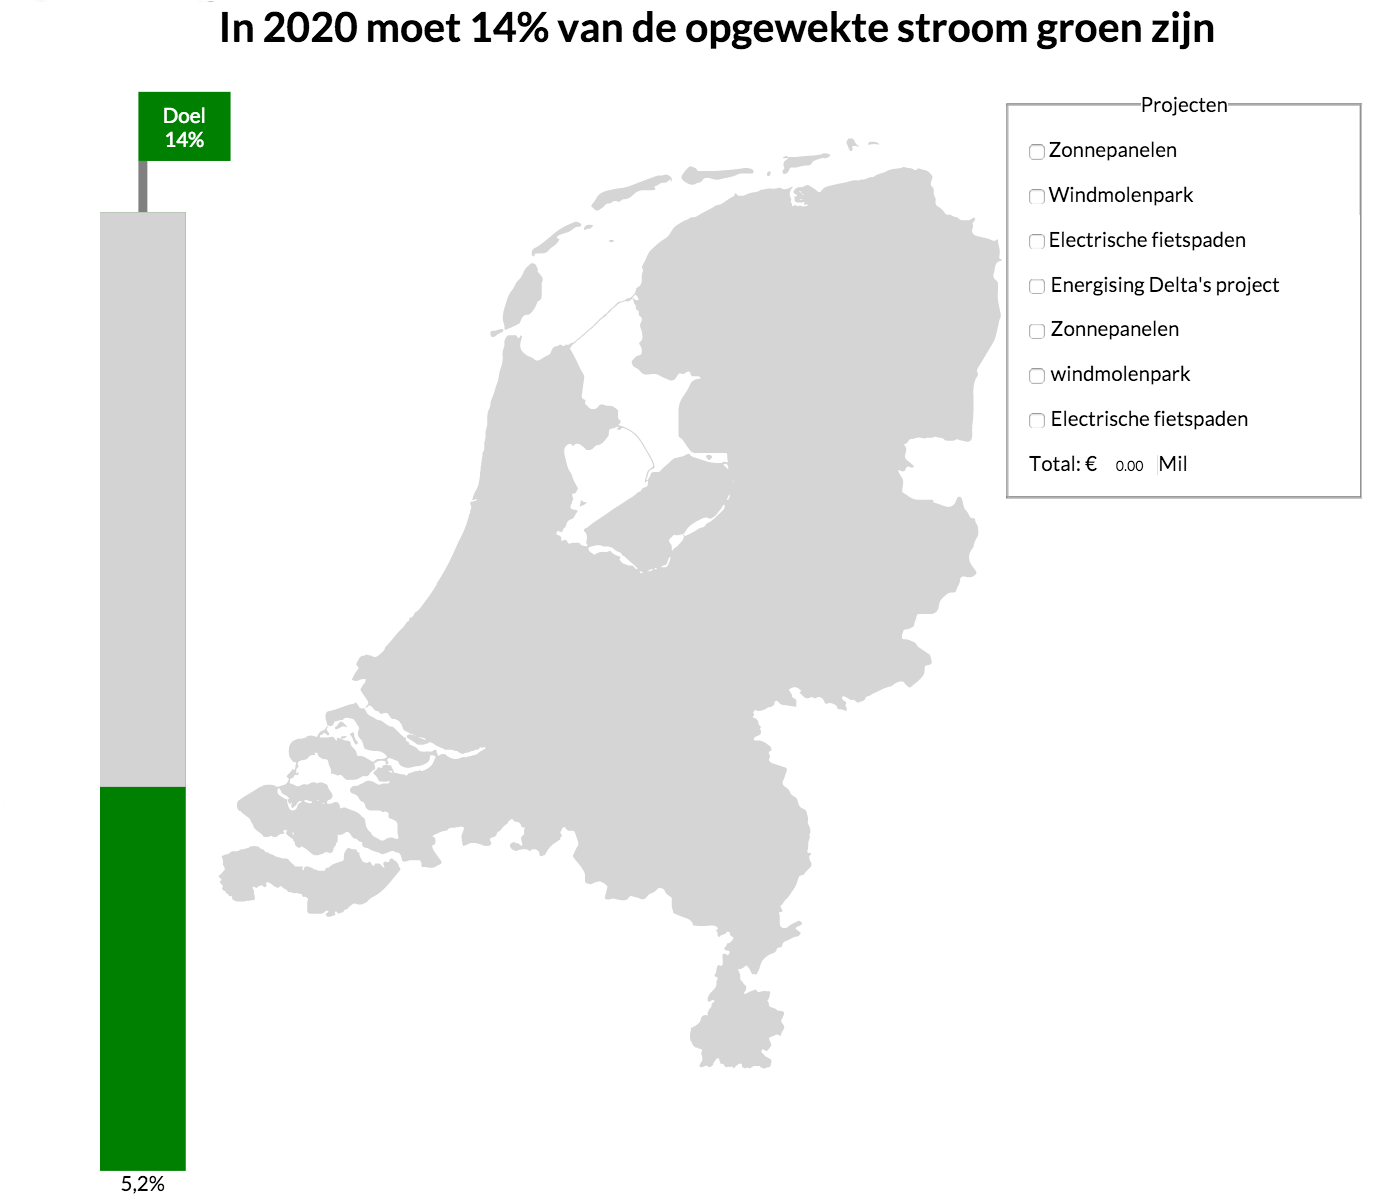
The end result is here.
The entire end result is in Dutch.
It starts with an intro video about the many opponents of wind turbines and we give more information about the Netherlands and renewable energy. After the video, you get to the map. The idea of the map is to get to the 14% by clicking on several projects.
I made the video and we thought of the style together.
You can also skip the video and go to the map right away here. Here's a screenshot of the map.
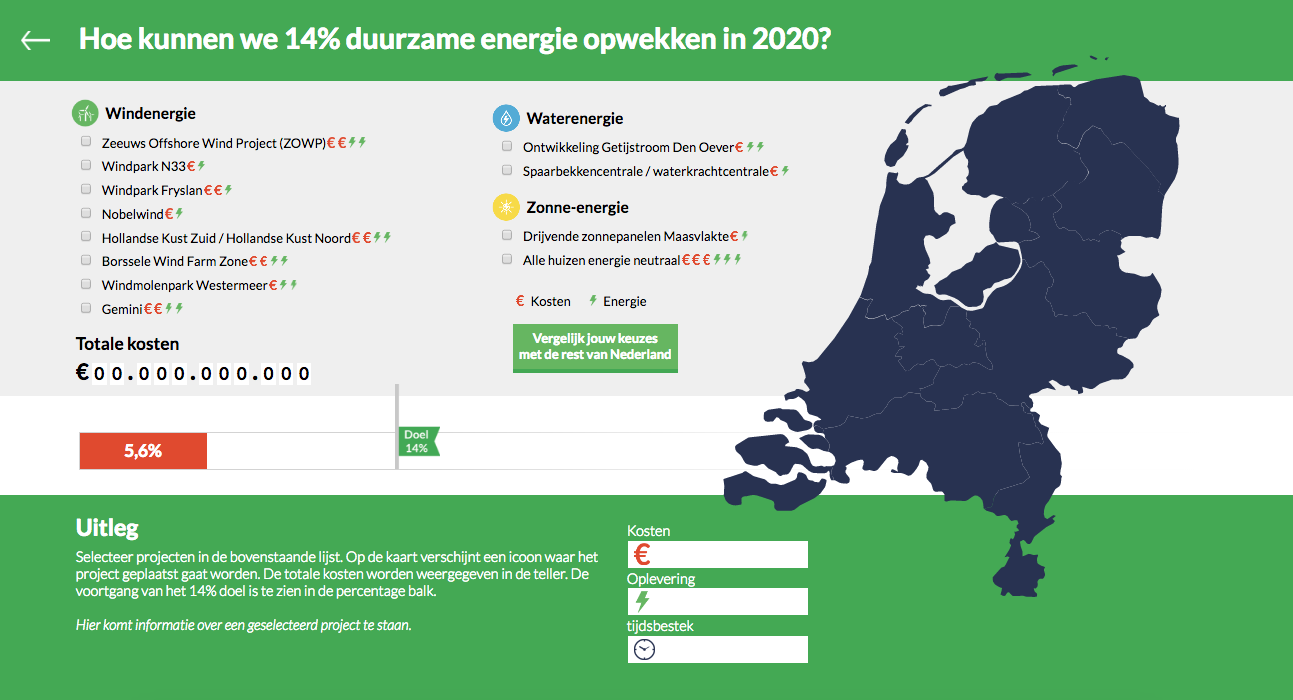
The website is designed for one resolution on a desktop/laptop. It does work on cell phones etc., but it's not responsive. We didn't make it responsive because of the lack of time.
The action of sharing your own plan doesn't work, but we had the idea of sharing it on social media so others can get into it too. To open up the conversation about being able to reach the 2020 14% goal. Next to that, we wanted it to be able to check what others think about different projects. This is also a prototype and you can open it from the map. Or you can look at that graph right here.
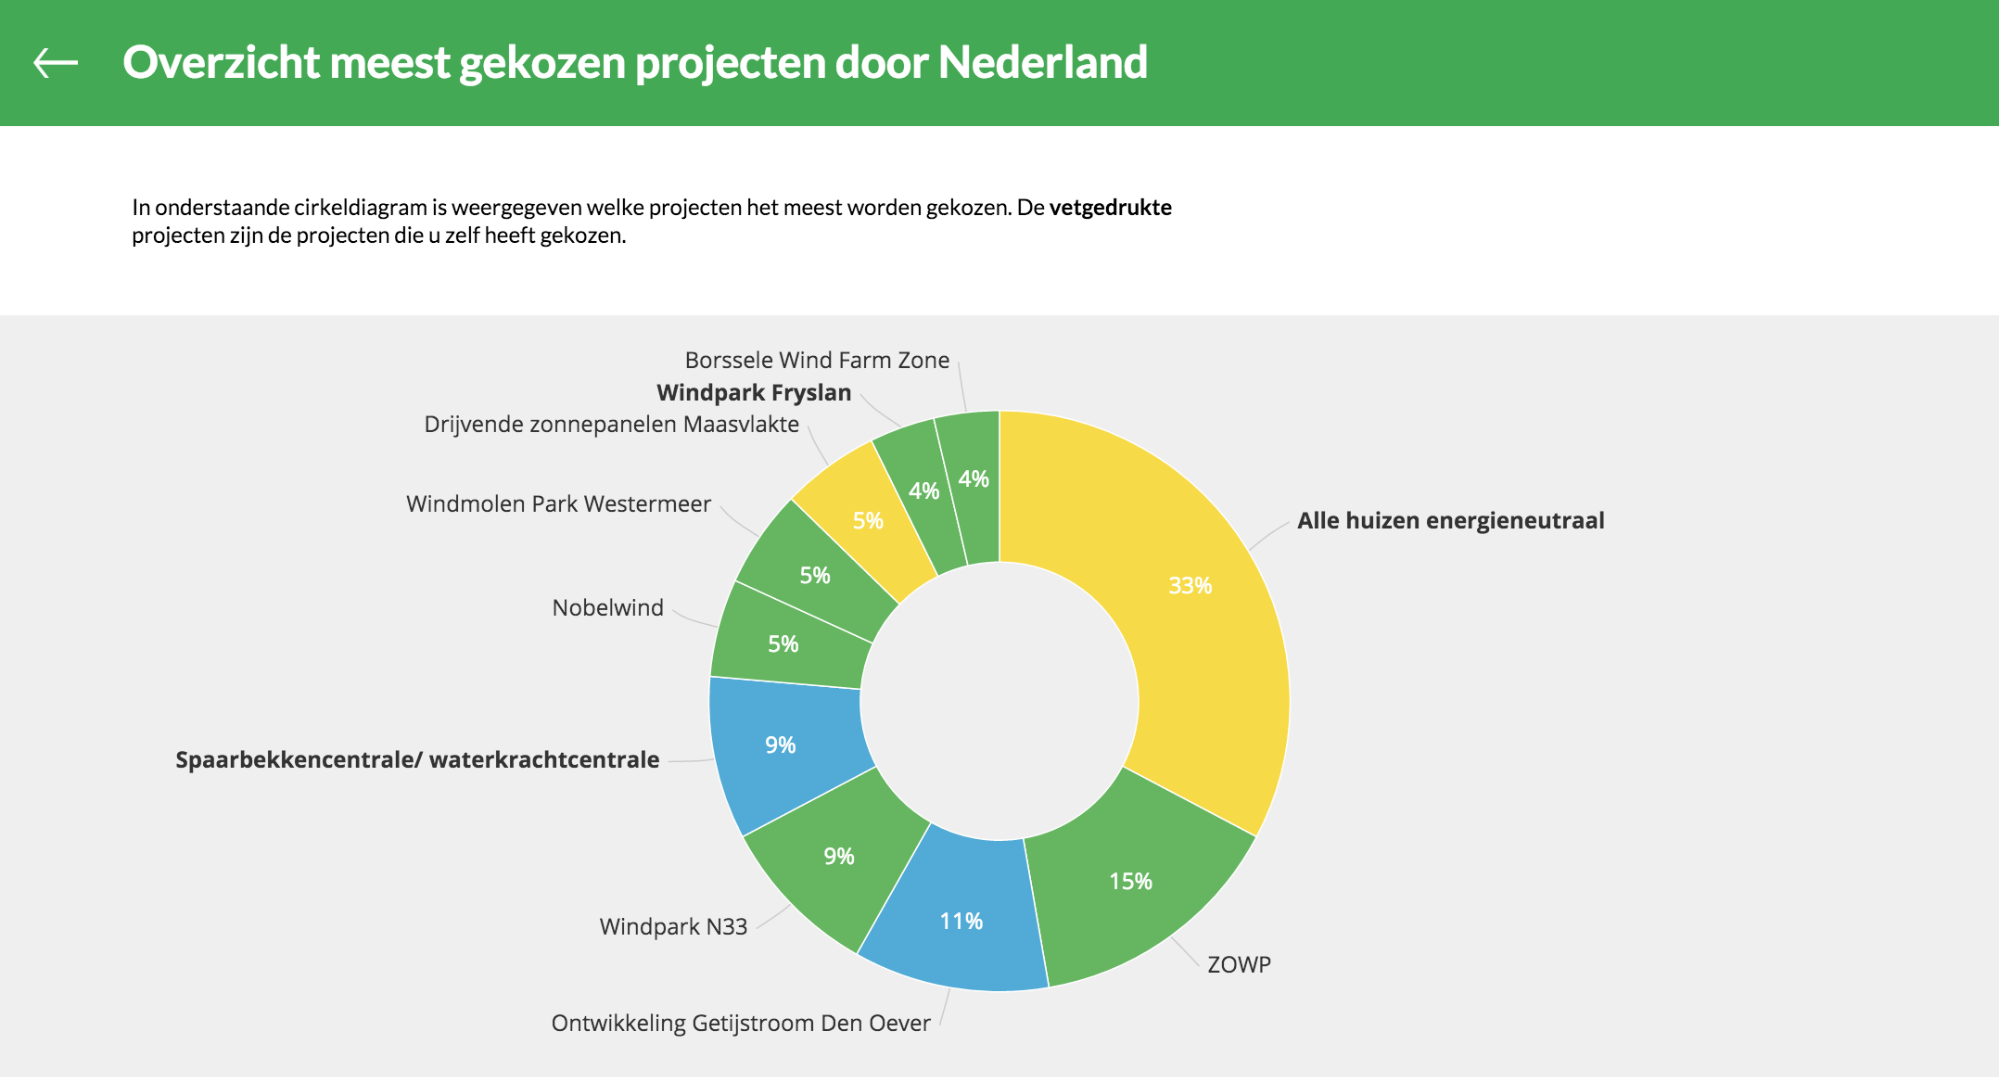
This graph is set up with d3.js. Our classes were about d3.js and Greensock.js. But in this project we only used a little d3.js.